About me: My name is Solène Rapenne, pronouns she/her. I like learning and
sharing knowledge. Hobbies: '(Qubes OS BSD OpenBSD Lisp cmdline gaming security QubesOS internet-stuff). I
love percent and lambda characters. Qubes OS core team member, former OpenBSD developer solene@. No AI is involved in this blog.
Contact me: solene at dataswamp dot org or
@solene@bsd.network (mastodon).
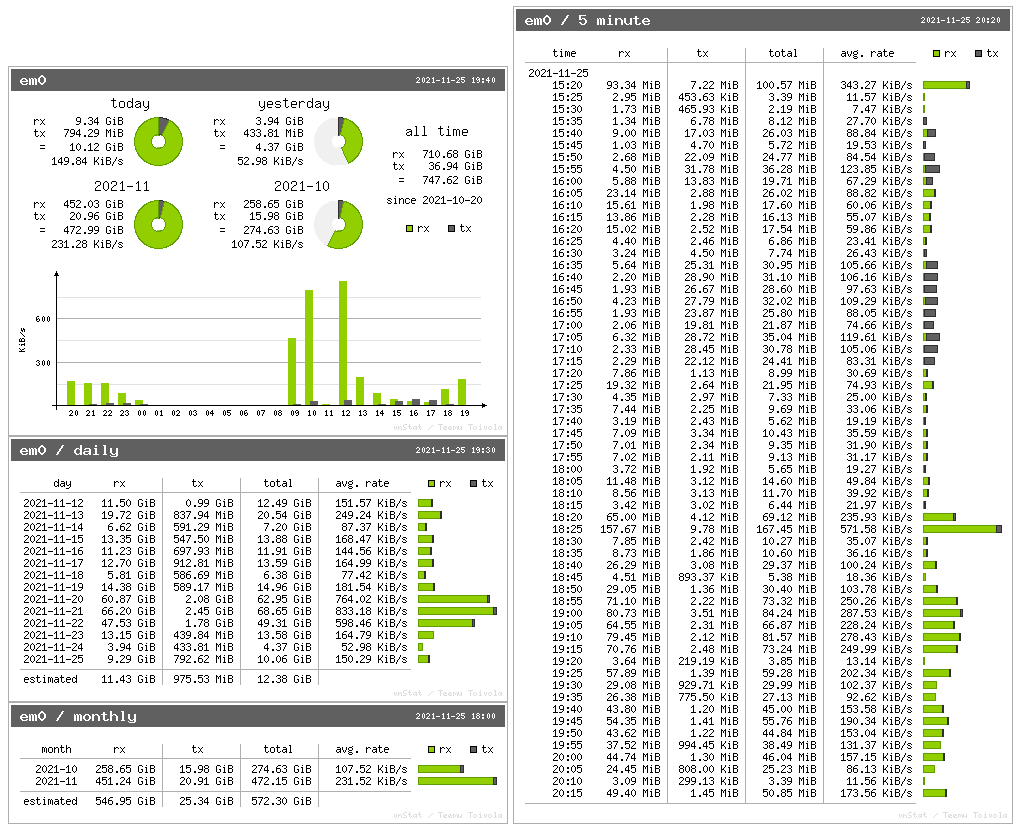
Hi! If you run a server or a router, you may want to have a nice view of the bandwidth usage and statistics. This is easy and quick to achieve using vnstat software. It will gather data regularly from network interfaces and store it in rrd files, it's very efficient and easy to use, and its companion program vnstati can generate pictures, perfect for easy visualization.
Create a script in /var/www/htdocs/dashboard and make it executable:
#!/bin/sh

cd /var/www/htdocs/dashboard/ || exit 1

# last 60 entries of 5 minutes stats
vnstati --fiveminutes 60 -o 5.png

# vertical summary of last two days
# refresh only after 60 minutes
vnstati -c 60 -vs -o vs.png

# daily stats for 14 last days
# refresh only after 60 minutes
vnstati -c 60 --days 14 -o d.png

# monthly stats for last 5 months
# refresh only after 300 minutes
vnstati -c 300 --months 5 -o m.png
and create a simple index.html file to display pictures:
Add a cron as root to run the script every 10 minutes using _vnstat user:
# add /usr/local/bin to $PATH to avoid issues finding vnstat
PATH=/bin:/sbin:/usr/bin:/usr/sbin:/usr/local/bin

*/10  *  *  *  * -ns su -m _vnstat -c "/var/www/htdocs/dashboard/vnstat.sh"
My personal crontab runs only from 8h to 23h because I will never look at my dashboard while I'm sleeping so I don't need to keep it updated, just replace * by 8-23 for the hour field.
Vnstat is fast, light and easy to use, but yet it produces nice results.
As an extra, you can run the vnstat commands (without the i) and use the raw text output to build an pure text dashboard if you don't want to use pictures (or http).