About me: My name is Solène Rapenne, pronouns she/her. I like learning and sharing knowledge. Hobbies: '(BSD OpenBSD Qubes OS Lisp cmdline gaming security QubesOS internet-stuff). I love percent and lambda characters. OpenBSD developer solene@. No AI is involved in this blog.

Contact me: solene at dataswamp dot org or @solene@bsd.network (mastodon).

You can sponsor my work financially if you want to help me writing this blog and contributing to Free Software as my daily job.

Explaining modern server monitoring stacks for self-hosting

Written by Solène, on 11 September 2022.
Tags: #nixos #monitoring #efficiency #nocloud

Comments on Fediverse/Mastodon

1.!/bin/introduction §

Hello 👋🏻, it's been a long time I didn't have to take a look at monitoring servers. I've set up a Grafana server six years ago, and I was using Munin for my personal servers.

However, I recently moved my server to a small virtual machine which has CPU and memory constraints (1 core / 1 GB of memory), and Munin didn't work very well. I was curious to learn if the Grafana stack changed since the last time I used it, and YES.

There is that project named Prometheus which is used absolutely everywhere, it was time for me to learn about it. And as I like to go against the flow, I tried various changes to the industry standard stack by using VictoriaMetrics.

In this article, I'm using NixOS configuration for the examples, however it should be obvious enough that you can still understand the parts if you don't know anything about NixOS.

2. The components §

VictoriaMetrics is a Prometheus drop-in replacement that is a lot more efficient (faster and use less resources), which also provides various API such as Graphite or InfluxDB. It's the component storing data. It comes with various programs like VictoriaMetrics agent to replace various parts of Prometheus.

Update: a dear reader shown me VictoriaMetrics can be used to scrape remote agents without the VictoriaMetrics agent, this reduce the memory usage and configuration required.

VictoriaMetrics official website

VictoriaMetrics documentation "how to scrape prometheus exporters such as node exporter"

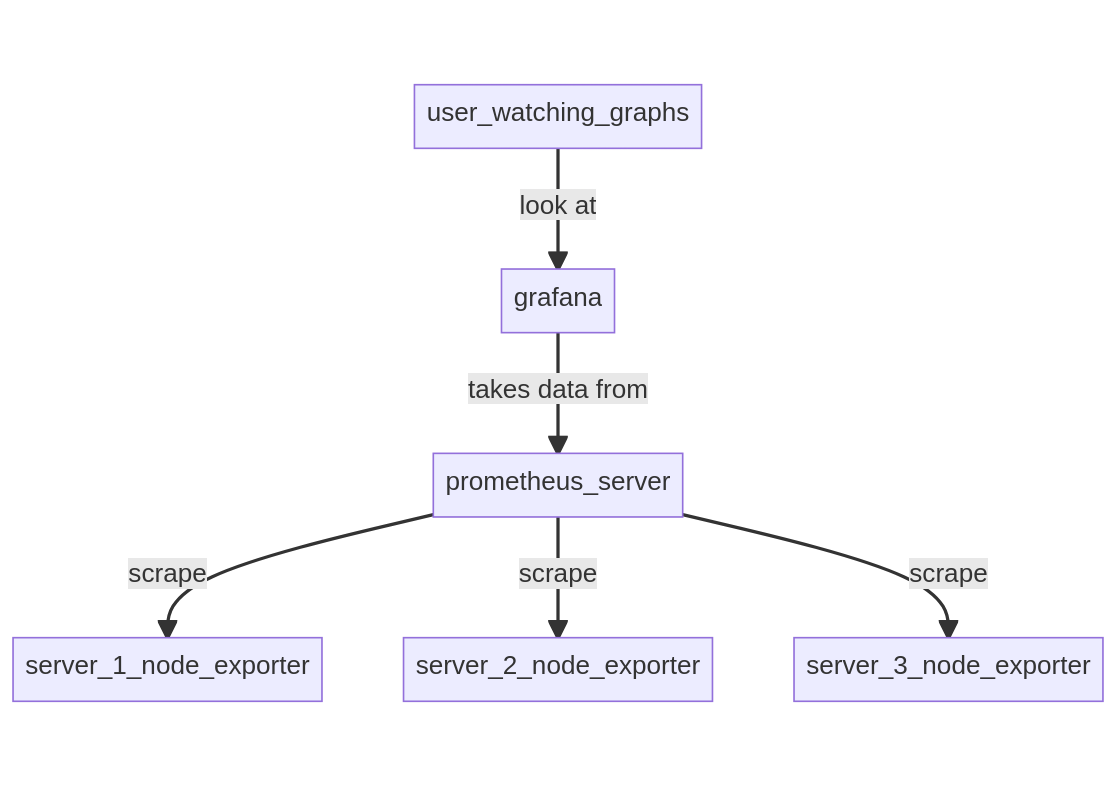
Prometheus is a time series database, which also provide a collecting agent named Node Exporter. It's also able to pull (scrape) data from remote services offering a Prometheus API.

Prometheus official website

Node Exporter GitHub page

NixOS is an operating system built with the Nix package manager, it has a declarative approach that requires to reconfigure the system when you need to make a change.

NixOS official website

Collectd is a agent gathering metrics from the system and sending it to a remote compatible database.

Collectd official website

Grafana is a powerful Web interface pulling data from time series databases to render them under useful charts for analysis.

Grafana official website

Node exporter full Grafana dashboard

3. Setup 1: Prometheus server scraping remote node_exporter §

In this setup, a Prometheus server is running on a server along with Grafana, and connects to remote servers running node_exporter to gather data.

Running it on my server, Grafana takes 67 MB, the local node_exporter 12.5 MB and Prometheus 63 MB.

USER         PID %CPU %MEM    VSZ   RSS TTY      STAT START   TIME COMMAND
grafana   837975  0.1  6.7 1384152 67836 ?       Ssl  01:19   1:07 grafana-server
node-ex+  953784  0.0  1.2 941292 12512 ?        Ssl  16:24   0:01 node_exporter
prometh+  983975  0.3  6.3 1226012 63284 ?       Ssl  17:07   0:00 prometheus
Setup 1 diagram
Setup 1 diagram
  • model: pull, Prometheus is connecting to all servers

3.1. Pros §

  • it's the industry standard
  • can use the "node exporter full" Grafana dashboard

3.2. Cons §

  • uses memory
  • you need to be able to reach all the remote nodes

3.3. Server §

{
  services.grafana.enable = true;
  services.prometheus.exporters.node.enable = true;

  services.prometheus = {
    enable = true;
    scrapeConfigs = [
      {
        job_name = "kikimora";
        static_configs = [
          {targets = ["10.43.43.2:9100"];}
        ];
      }
      {
        job_name = "interbus";
        static_configs = [
          {targets = ["127.0.0.1:9100"];}
        ];
      }
    ];
  };
}

3.4. Client §

{
  networking.firewall.allowedTCPPorts = [9100];
  services.prometheus.exporters.node.enable = true;
}

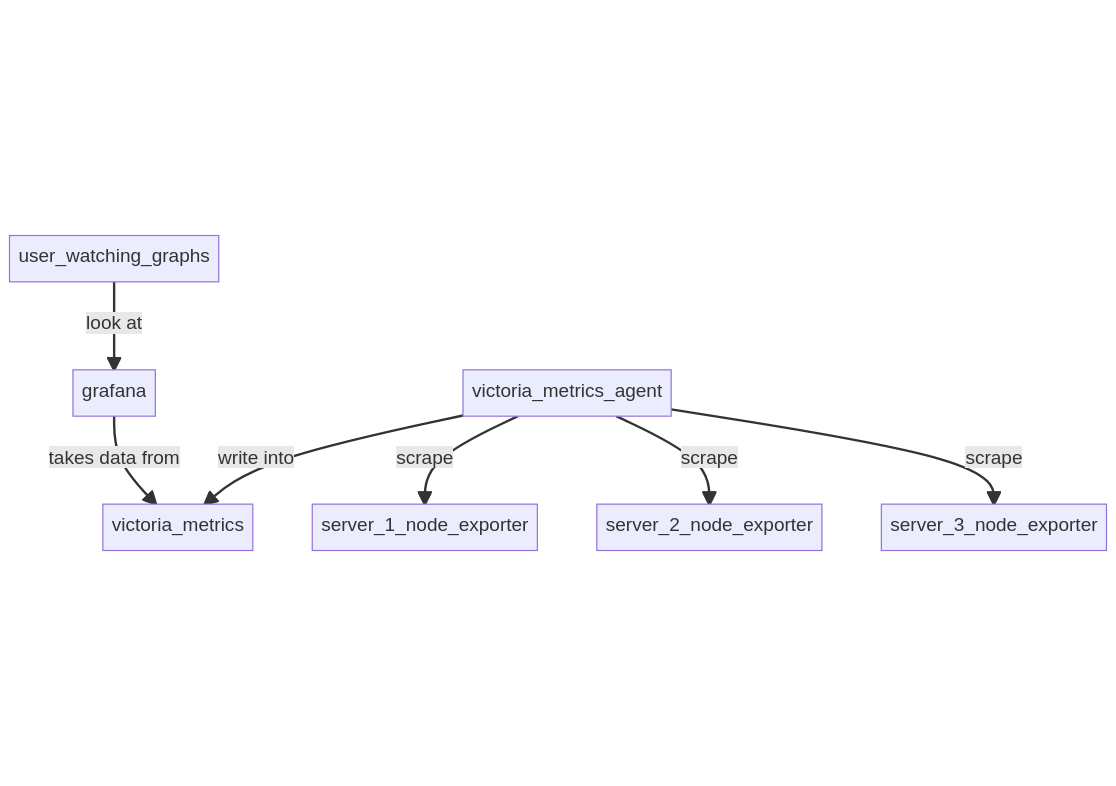
4. Setup 2: VictoriaMetrics + node-exporter in pull model §

In this setup, a VictoriaMetrics server is running on a server along with Grafana. A VictoriaMetrics agent is running locally to gather data from remote servers running node_exporter.

Running it on my server, Grafana takes 67 MB, the local node_exporter 12.5 MB, VictoriaMetrics 30 MB and its agent 13.8 MB.

USER         PID %CPU %MEM    VSZ   RSS TTY      STAT START   TIME COMMAND
grafana   837975  0.1  6.7 1384152 67836 ?       Ssl  01:19   1:07 grafana-server
node-ex+  953784  0.0  1.2 941292 12512 ?        Ssl  16:24   0:01 node_exporter
victori+  986126  0.1  3.0 1287016 30052 ?       Ssl  18:00   0:03 victoria-metric
root      987944  0.0  1.3 1086276 13856 ?       Sl   18:30   0:00 vmagent
Setup 2 diagram
Setup 2 diagram
  • model: pull, VictoriaMetrics agent is connecting to all servers

4.1. Pros §

  • can use the "node exporter full" Grafana dashboard
  • lightweight and more performant than Prometheus

4.2. Cons §

  • you need to be able to reach all the remote nodes

4.3. Server §

let
  configure_prom = builtins.toFile "prometheus.yml" ''
    scrape_configs:
    - job_name: 'kikimora'
      stream_parse: true
      static_configs:
      - targets:
        - 10.43.43.1:9100
    - job_name: 'interbus'
      stream_parse: true
      static_configs:
      - targets:
        - 127.0.0.1:9100
  '';
in {
  services.victoriametrics.enable = true;
  services.grafana.enable = true;

  systemd.services.export-to-prometheus = {
    path = with pkgs; [victoriametrics];
    enable = true;
    after = ["network-online.target"];
    wantedBy = ["multi-user.target"];
    script = "vmagent -promscrape.config=${configure_prom} -remoteWrite.url=http://127.0.0.1:8428/api/v1/write";
  };
}

4.4. Client §

{
  networking.firewall.allowedTCPPorts = [9100];
  services.prometheus.exporters.node.enable = true;
}

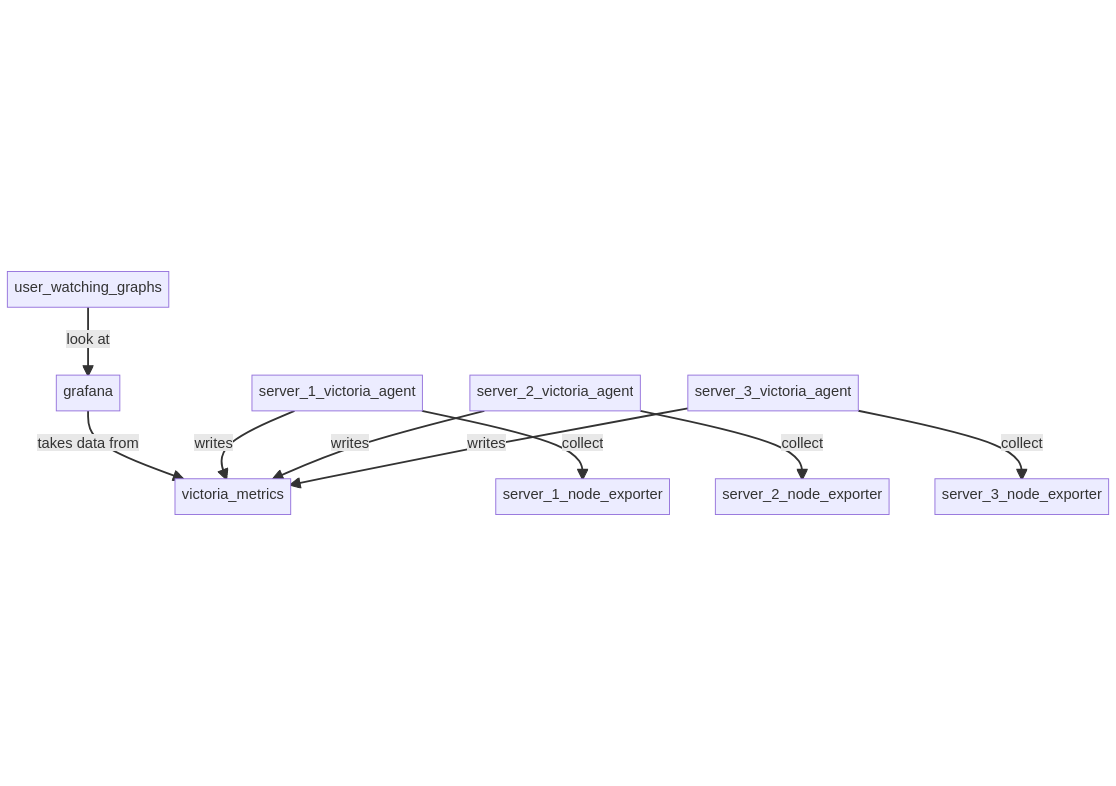
5. Setup 3: VictoriaMetrics + node-exporter in push model §

In this setup, a VictoriaMetrics server is running on a server along with Grafana, on each server node_exporter and VictoriaMetrics agent are running to export data to the central VictoriaMetrics server.

Running it on my server, Grafana takes 67 MB, the local node_exporter 12.5 MB, VictoriaMetrics 30 MB and its agent 13.8 MB, which is exactly the same as the setup 2, except the VictoriaMetrics agent is running on all remote servers.

USER         PID %CPU %MEM    VSZ   RSS TTY      STAT START   TIME COMMAND
grafana   837975  0.1  6.7 1384152 67836 ?       Ssl  01:19   1:07 grafana-server
node-ex+  953784  0.0  1.2 941292 12512 ?        Ssl  16:24   0:01 node_exporter
victori+  986126  0.1  3.0 1287016 30052 ?       Ssl  18:00   0:03 victoria-metric
root      987944  0.0  1.3 1086276 13856 ?       Sl   18:30   0:00 vmagent
Setup 3 diagram
Setup 3 diagram
  • model: push, each agent is connecting to the VictoriaMetrics server

5.1. Pros §

  • can use the "node exporter full" Grafana dashboard
  • memory efficient
  • can bypass firewalls easily

5.2. Cons §

  • you need to be able to reach all the remote nodes
  • more maintenance as you have one extra agent on each remote
  • may be bad for security, you need to allow remote servers to write to your VictoriaMetrics server

5.3. Server §

{
  networking.firewall.allowedTCPPorts = [8428];
  services.victoriametrics.enable = true;
  services.grafana.enable = true;
  services.prometheus.exporters.node.enable = true;
}

5.4. Client §

let
  configure_prom = builtins.toFile "prometheus.yml" ''
    scrape_configs:
    - job_name: '${config.networking.hostName}'
      stream_parse: true
      static_configs:
      - targets:
        - 127.0.0.1:9100
  '';
in {
  services.prometheus.exporters.node.enable = true;
  
  systemd.services.export-to-prometheus = {
    path = with pkgs; [victoriametrics];
    enable = true;
    after = ["network-online.target"];
    wantedBy = ["multi-user.target"];
    script = "vmagent -promscrape.config=${configure_prom} -remoteWrite.url=http://victoria-server.domain:8428/api/v1/write";
  };
}

6. Setup 4: VictoriaMetrics + Collectd §

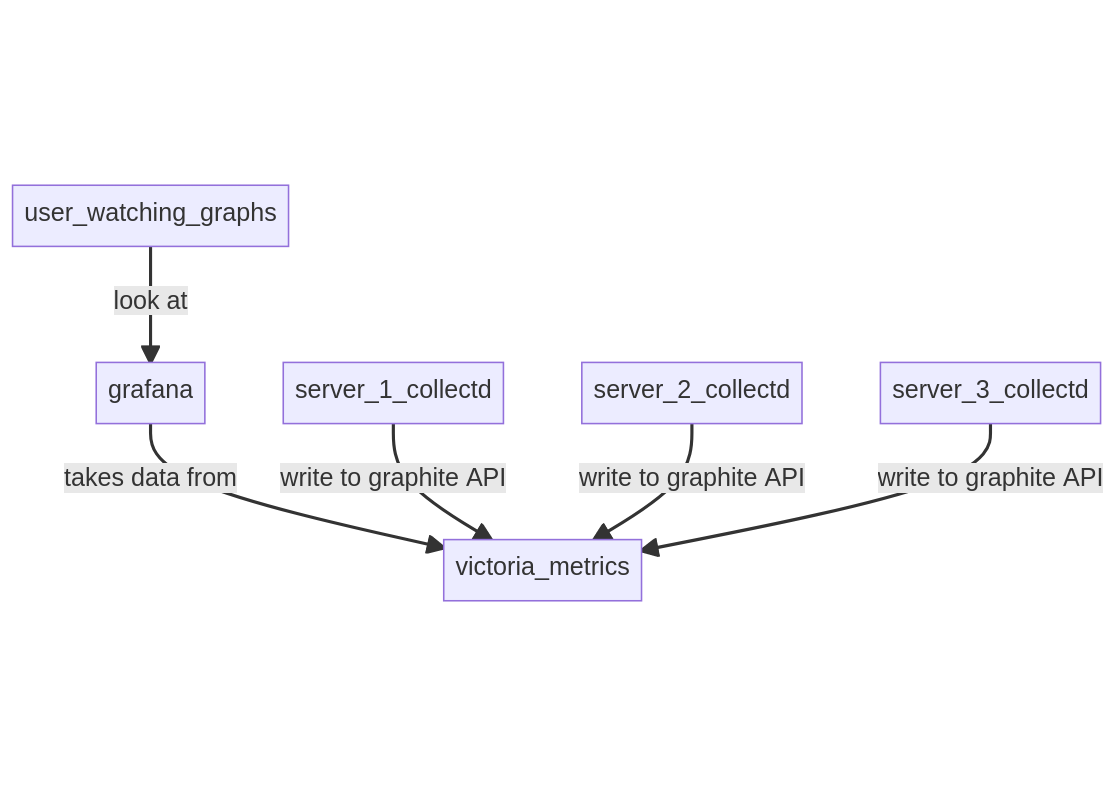
In this setup, a VictoriaMetrics server is running on a server along with Grafana, servers are running Collectd sending data to VictoriaMetrics graphite API.

Running it on my server, Grafana takes 67 MB, VictoriaMetrics 30 MB and Collectd 172 kB (yes).

USER         PID %CPU %MEM    VSZ   RSS TTY      STAT START   TIME COMMAND
grafana   837975  0.1  6.7 1384152 67836 ?       Ssl  01:19   1:07 grafana-server
victori+  986126  0.1  3.0 1287016 30052 ?       Ssl  18:00   0:03 victoria-metric
collectd  844275  0.0  0.0 610432   172 ?        Ssl  02:07   0:00 collectd
Setup 4 diagram
Setup 4 diagram
  • model: push, VictoriaMetrics receives data from the Collectd servers

6.1. Pros §

  • super memory efficient
  • can bypass firewalls easily

6.2. Cons §

  • you can't use the "node exporter full" Grafana dashboard
  • may be bad for security, you need to allow remote servers to write to your VictoriaMetrics server
  • you need to configure Collectd for each host

6.3. Server §

The server requires VictoriaMetrics to run exposing its graphite API on ports 2003.

Note that in Grafana, you will have to escape "-" characters using "\-" in the queries. I also didn't find a way to automatically discover hosts in the data to use variables in the dashboard.

UPDATE: Using write_tsdb exporter in collectd, and exposing a TSDB API with VictoriaMetrics, you can set a label to each host, and then use the query "label_values(status)" in Grafana to automatic discover hosts.

{
  networking.firewall.allowedTCPPorts = [2003];
  services.victoriametrics = {
    enable = true;
    extraOptions = [
      "-graphiteListenAddr=:2003"
    ];
  };
  services.grafana.enable = true;
  
}

6.4. Client §

We only need to enable Collectd on the client:

{
  services.collectd = {
    enable = true;
    autoLoadPlugin = true;
    extraConfig = ''
      Interval 30
    '';
    plugins = {
      "write_graphite" = ''
        <Node "${config.networking.hostName}">
          Host "victoria-server.fqdn"
          Port "2003"
          Protocol "tcp"
          LogSendErrors true
          Prefix "collectd_"
        </Node>
      '';
      cpu = ''
        ReportByCpu false
      '';
      memory = "";
      df = ''
        Mountpoint "/"
        Mountpoint "/nix/store"
        Mountpoint "/home"
        ValuesPercentage True
        ValuesAbsolute False
      '';
      load = "";
      uptime = "";
      swap = ''
        ReportBytes false
        ReportIO false
        ValuesPercentage true
      '';
      interface = ''
        ReportInactive false
      '';
    };
  };
}

7. Trivia §

The first section named #!/bin/introduction" is on purpose and not a mistake. It felt super fun when I started writing the article, and wanted to keep it that way.

The Collectd setup is the most minimalistic while still powerful, but it requires lot of work to make the dashboards and configure the plugins correctly.

The setup I like best is the setup 2.